In 2012, Matt Might, a professor of computer science at the University of Utah, created The Illustrated Guide to the Ph.D. This clever data visualization has helped him explain what a Ph.D. is to his incoming doctoral student each year since. The clear, simple, and effective design will ring true for anyone who has gone through the Ph.D. process, and will provide clarity for anyone thinking about taking the plunge.
Over time, his slides have been translated into over 30 languages, meaning Ph.D. students around the world are learning the same lesson. While a PDF version is available for download, Might also provides a print version of the infographic for $6.50. The money goes toward supporting graduate students studying biology that may impact treatment of diseases of cellular metabolism in honor of Might's son, who was born with a rare genetic disease.
This education infographic was developed by professor Matt Might as a clear, effective way to explain a Ph.D. to incoming students.
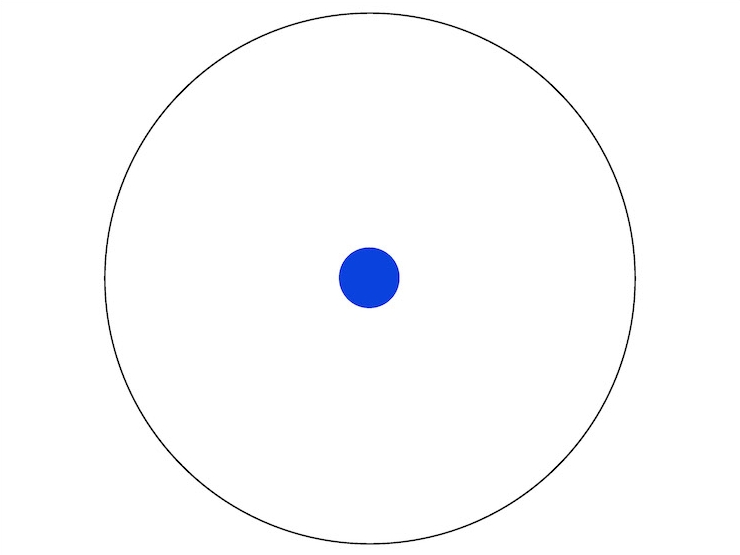
Imagine a circle that contains all of human knowledge:

By the time you finish elementary school, you know a little:
By the time you finish high school, you know a bit more:
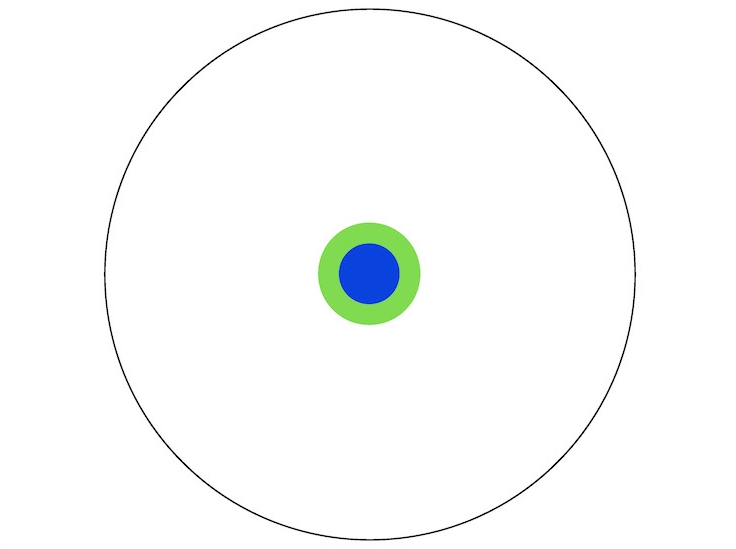
With a bachelor's degree, you gain a specialty:
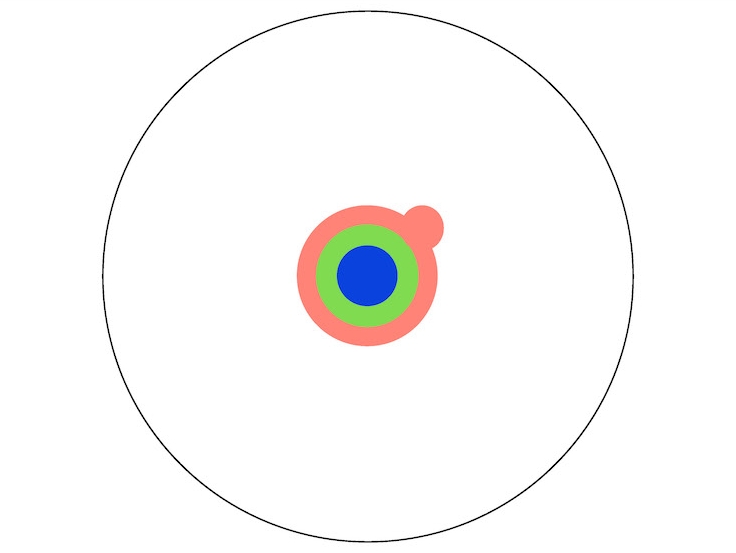
A master's degree deepens that specialty:
Reading research papers takes you to the edge of human knowledge:
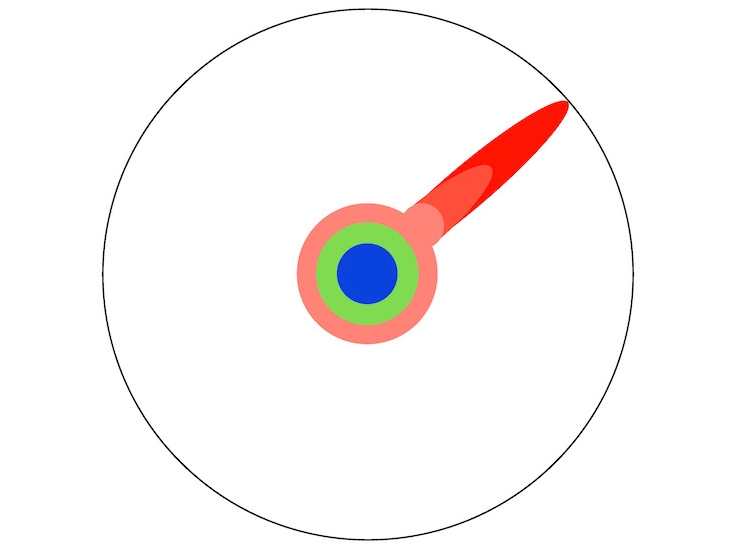
Once you're at the boundary, you focus:
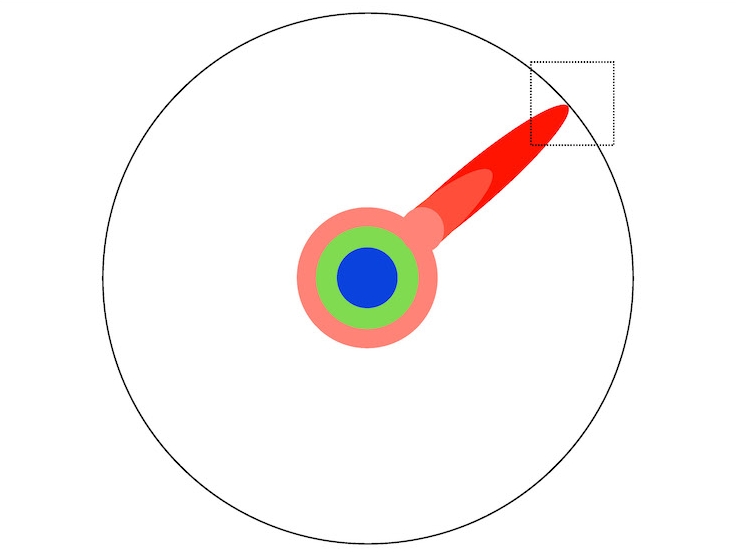
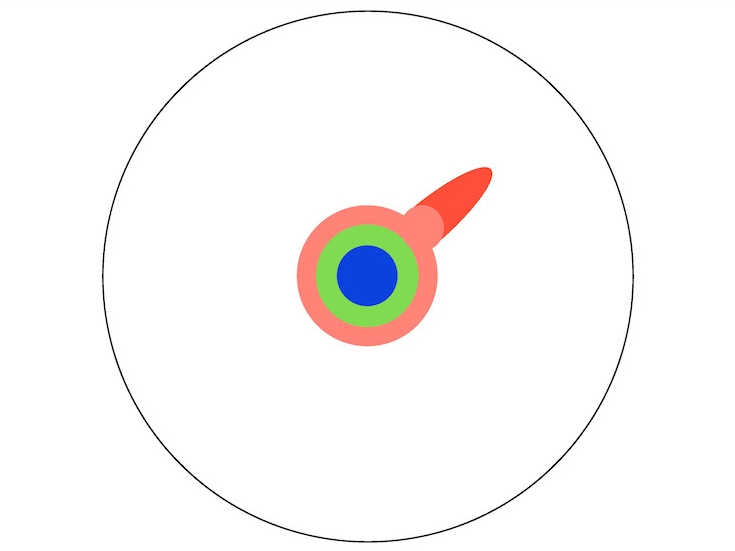
You push at the boundary for a few years:

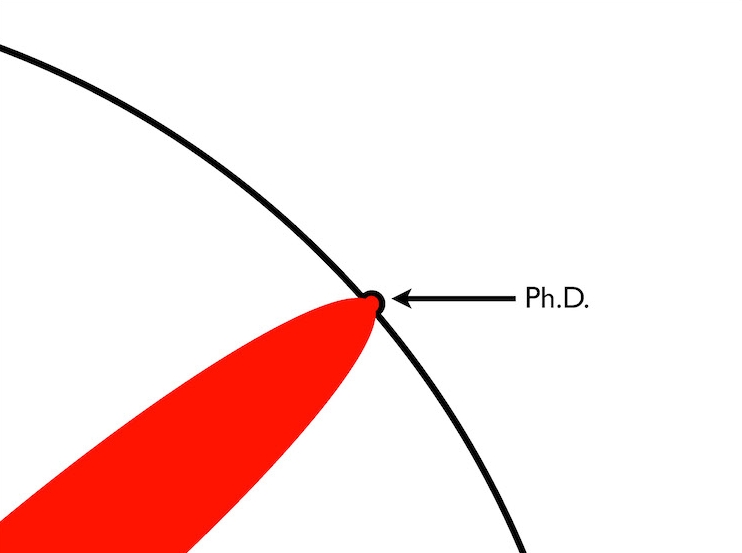
Until one day, the boundary gives way:

And, that dent you've made is called a Ph.D.:
Of course, the world looks different to you now:

So, don't forget the bigger picture:

Keep pushing.
Matt Might: Website
h/t: [Open Culture]
All images via Matt Might.
Related Articles:
30+ Creative Infographics to Keep Your Mind Active and Entertained
Infographic Reveals the Happiness of Remote Workers vs. Office Employees
Helpful Infographic Offers 10 Useful Tips to Boost Your Daily Productivity
Infographic Reimagines “Smart” to Reveal Nine Types of Intelligence That Everyone Possesses